AT&T + DirecTV — Enterprise BI Platform Transformation

End-to-end consolidation of fragmented BI tools into a unified, scalable platform — standardizing dashboards, data models, and decision workflows at enterprise scale.

Impact Operational Efficiency: ~$12M cost savings (internal)
Impact Speed-to-Ship: ~20% faster development (internal)
Impact Workflow Performance: ~25% workflow improvement (internal)
Impact Adoption & Trust: increased usage/engagement; improved decision speed (internal)
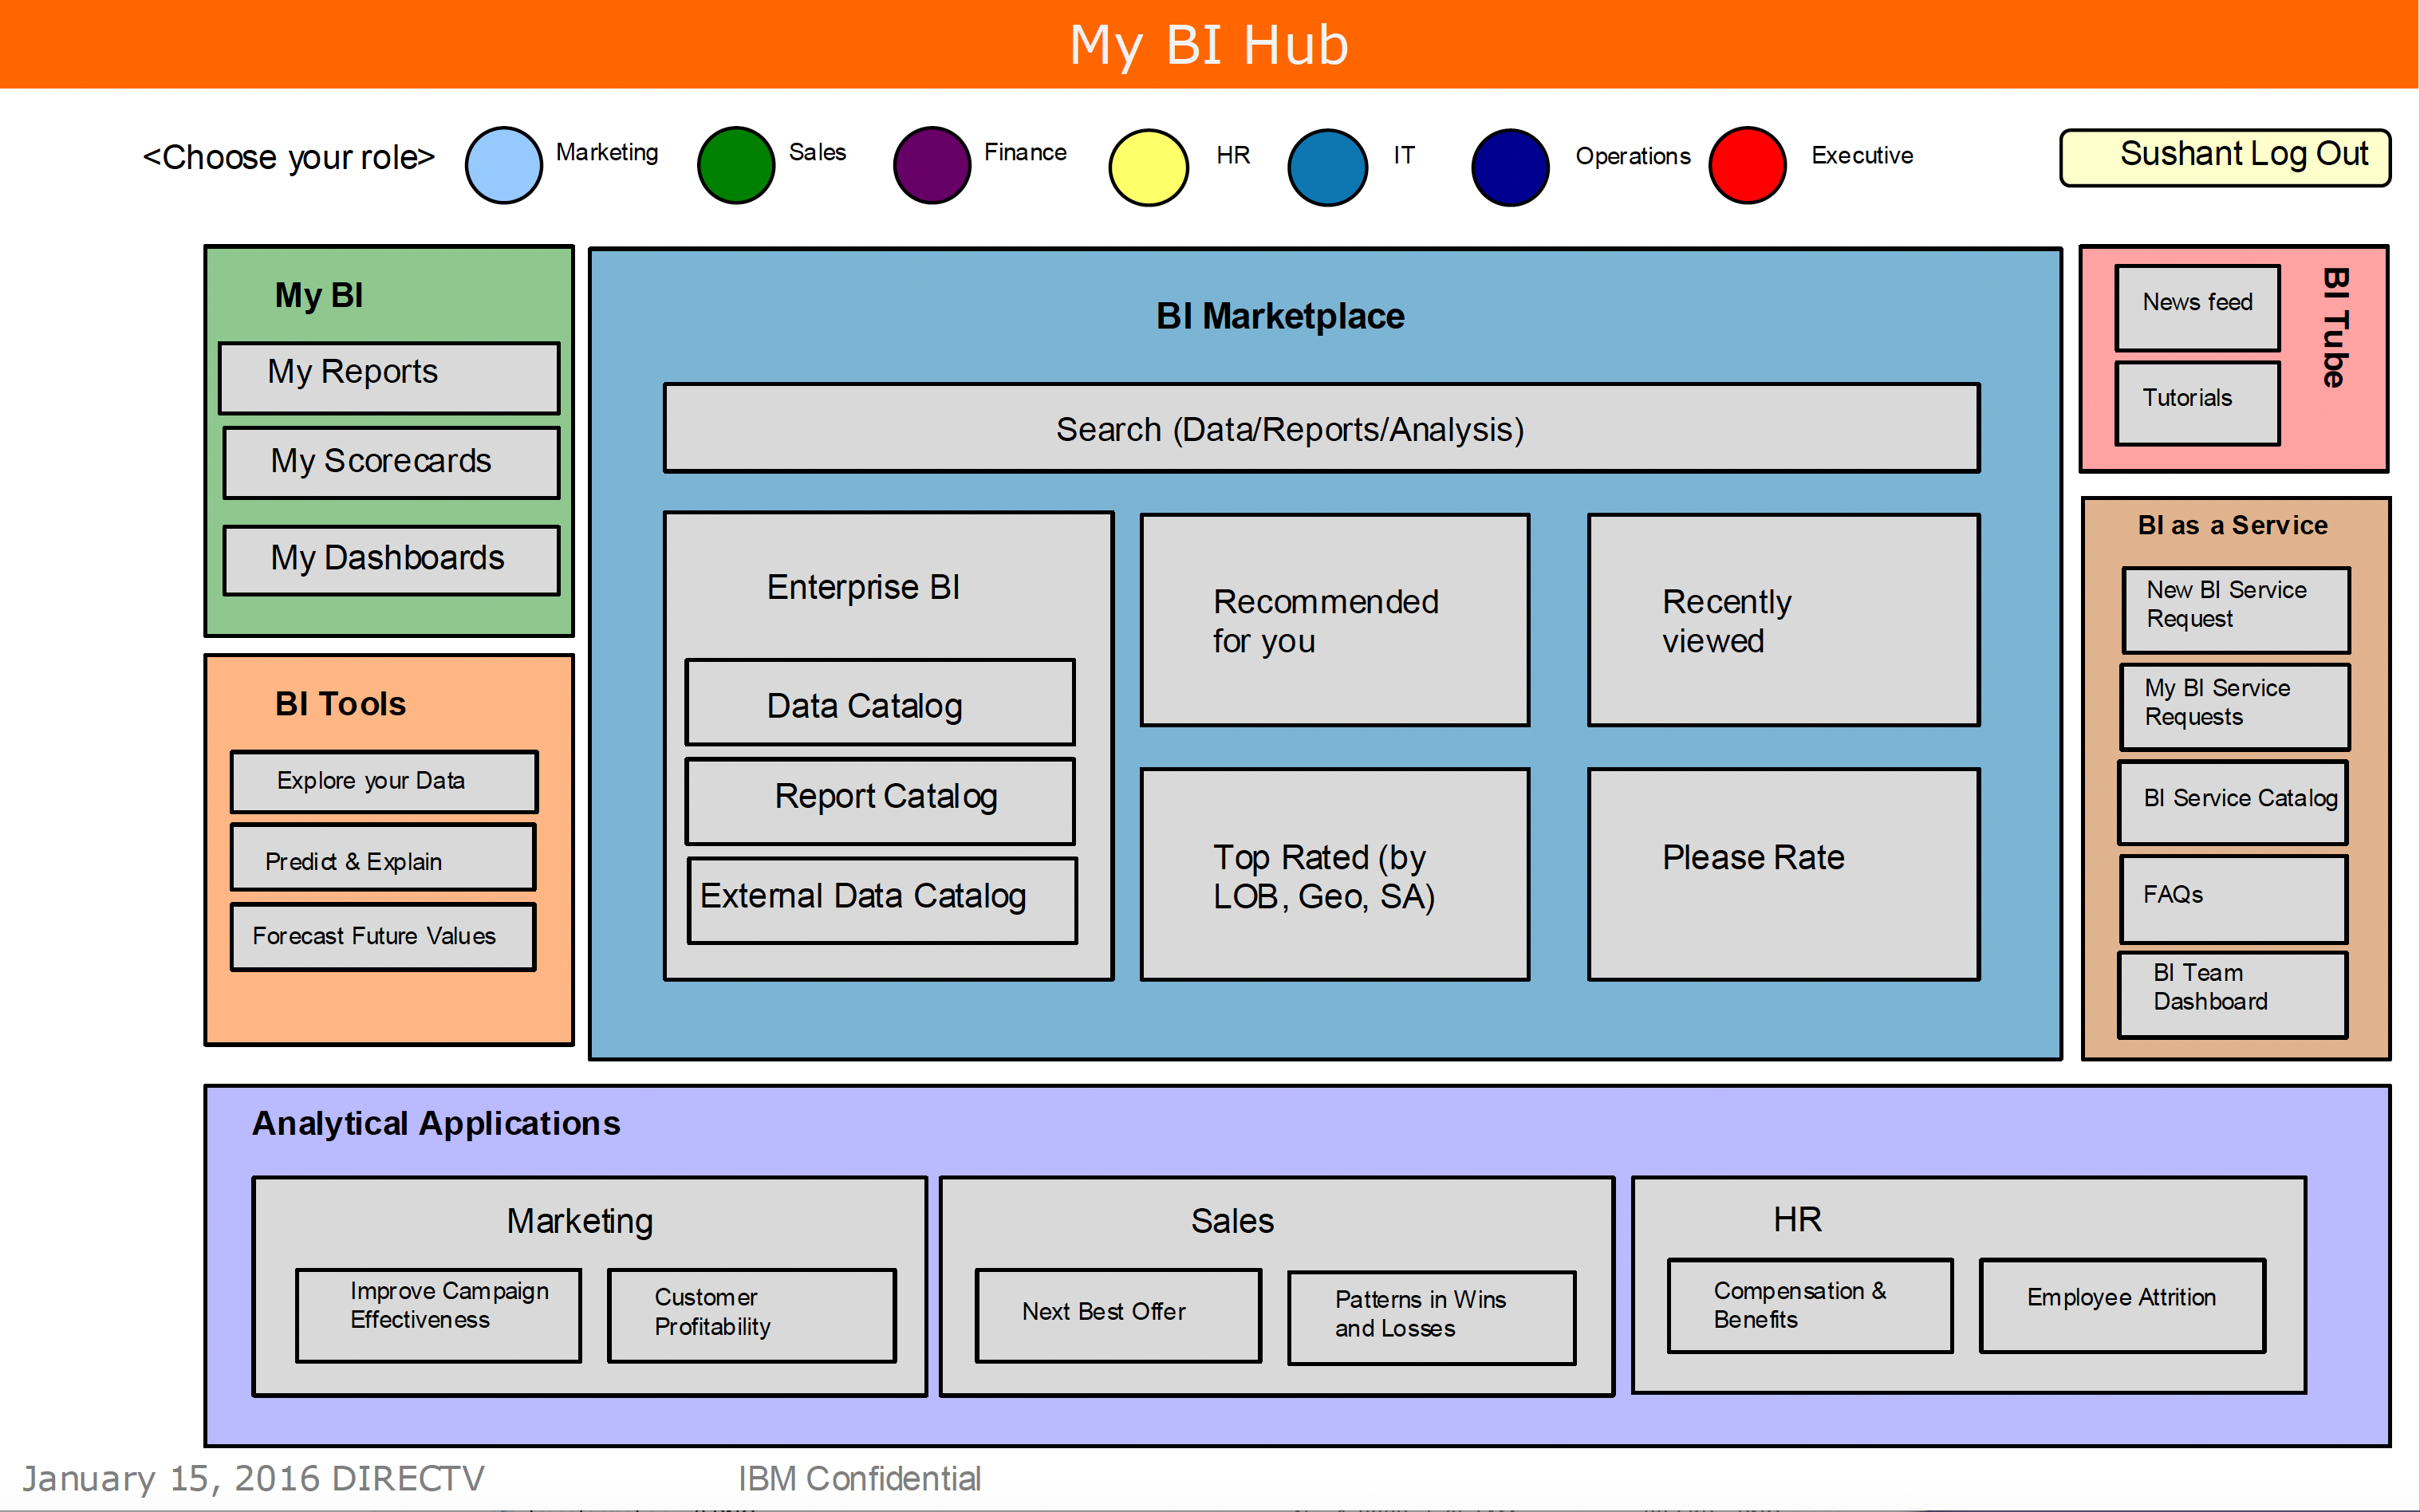
  • Mandate: Transform fragmented BI dashboards and reporting into an enterprise platform executives and business teams can trust for KPI visibility and decision support.
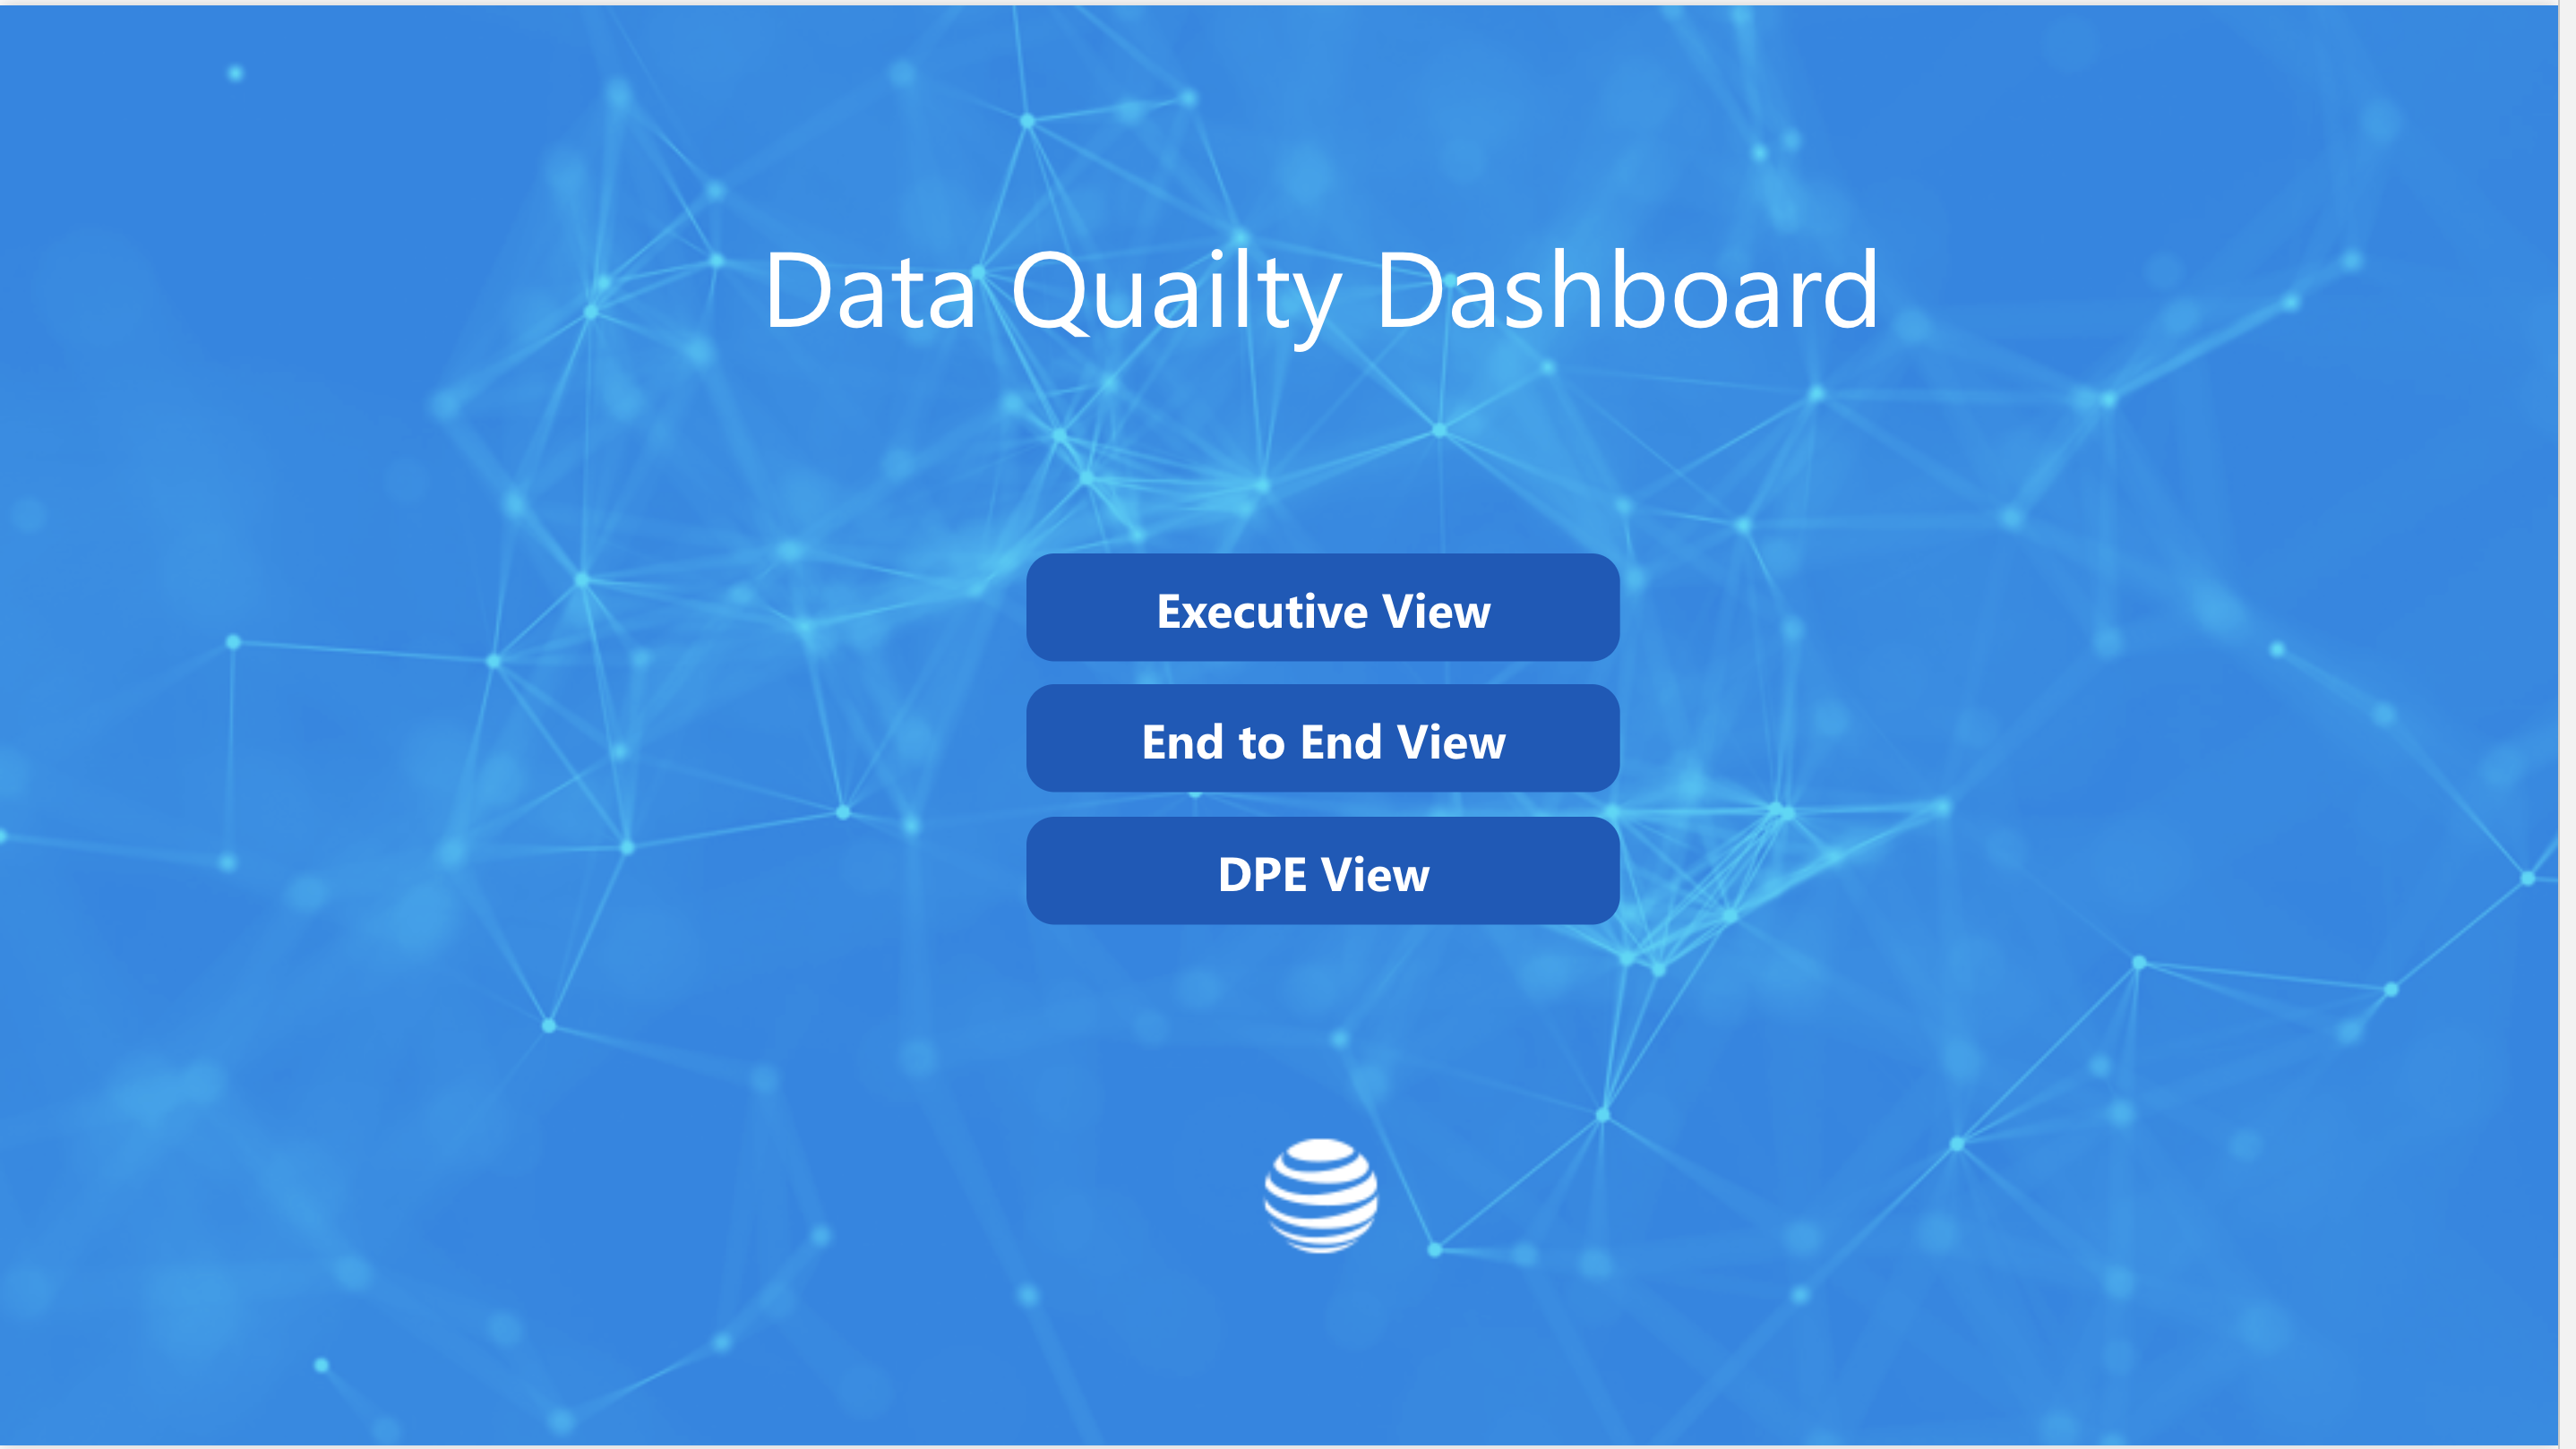
  • Designed and delivered enterprise BI dashboards and reporting systems enabling teams to monitor KPIs, adoption, and operational performance.

Enterprise-wide BI ecosystem across multiple business units, shared data models, standardized workflows, and scaled rollout across product lines.

Role: Owned UX and platform strategy for enterprise BI transformation; defined unified experience vision; established governance (RACI, three-in-a-box); aligned Product, Engineering, and Data teams across business units.

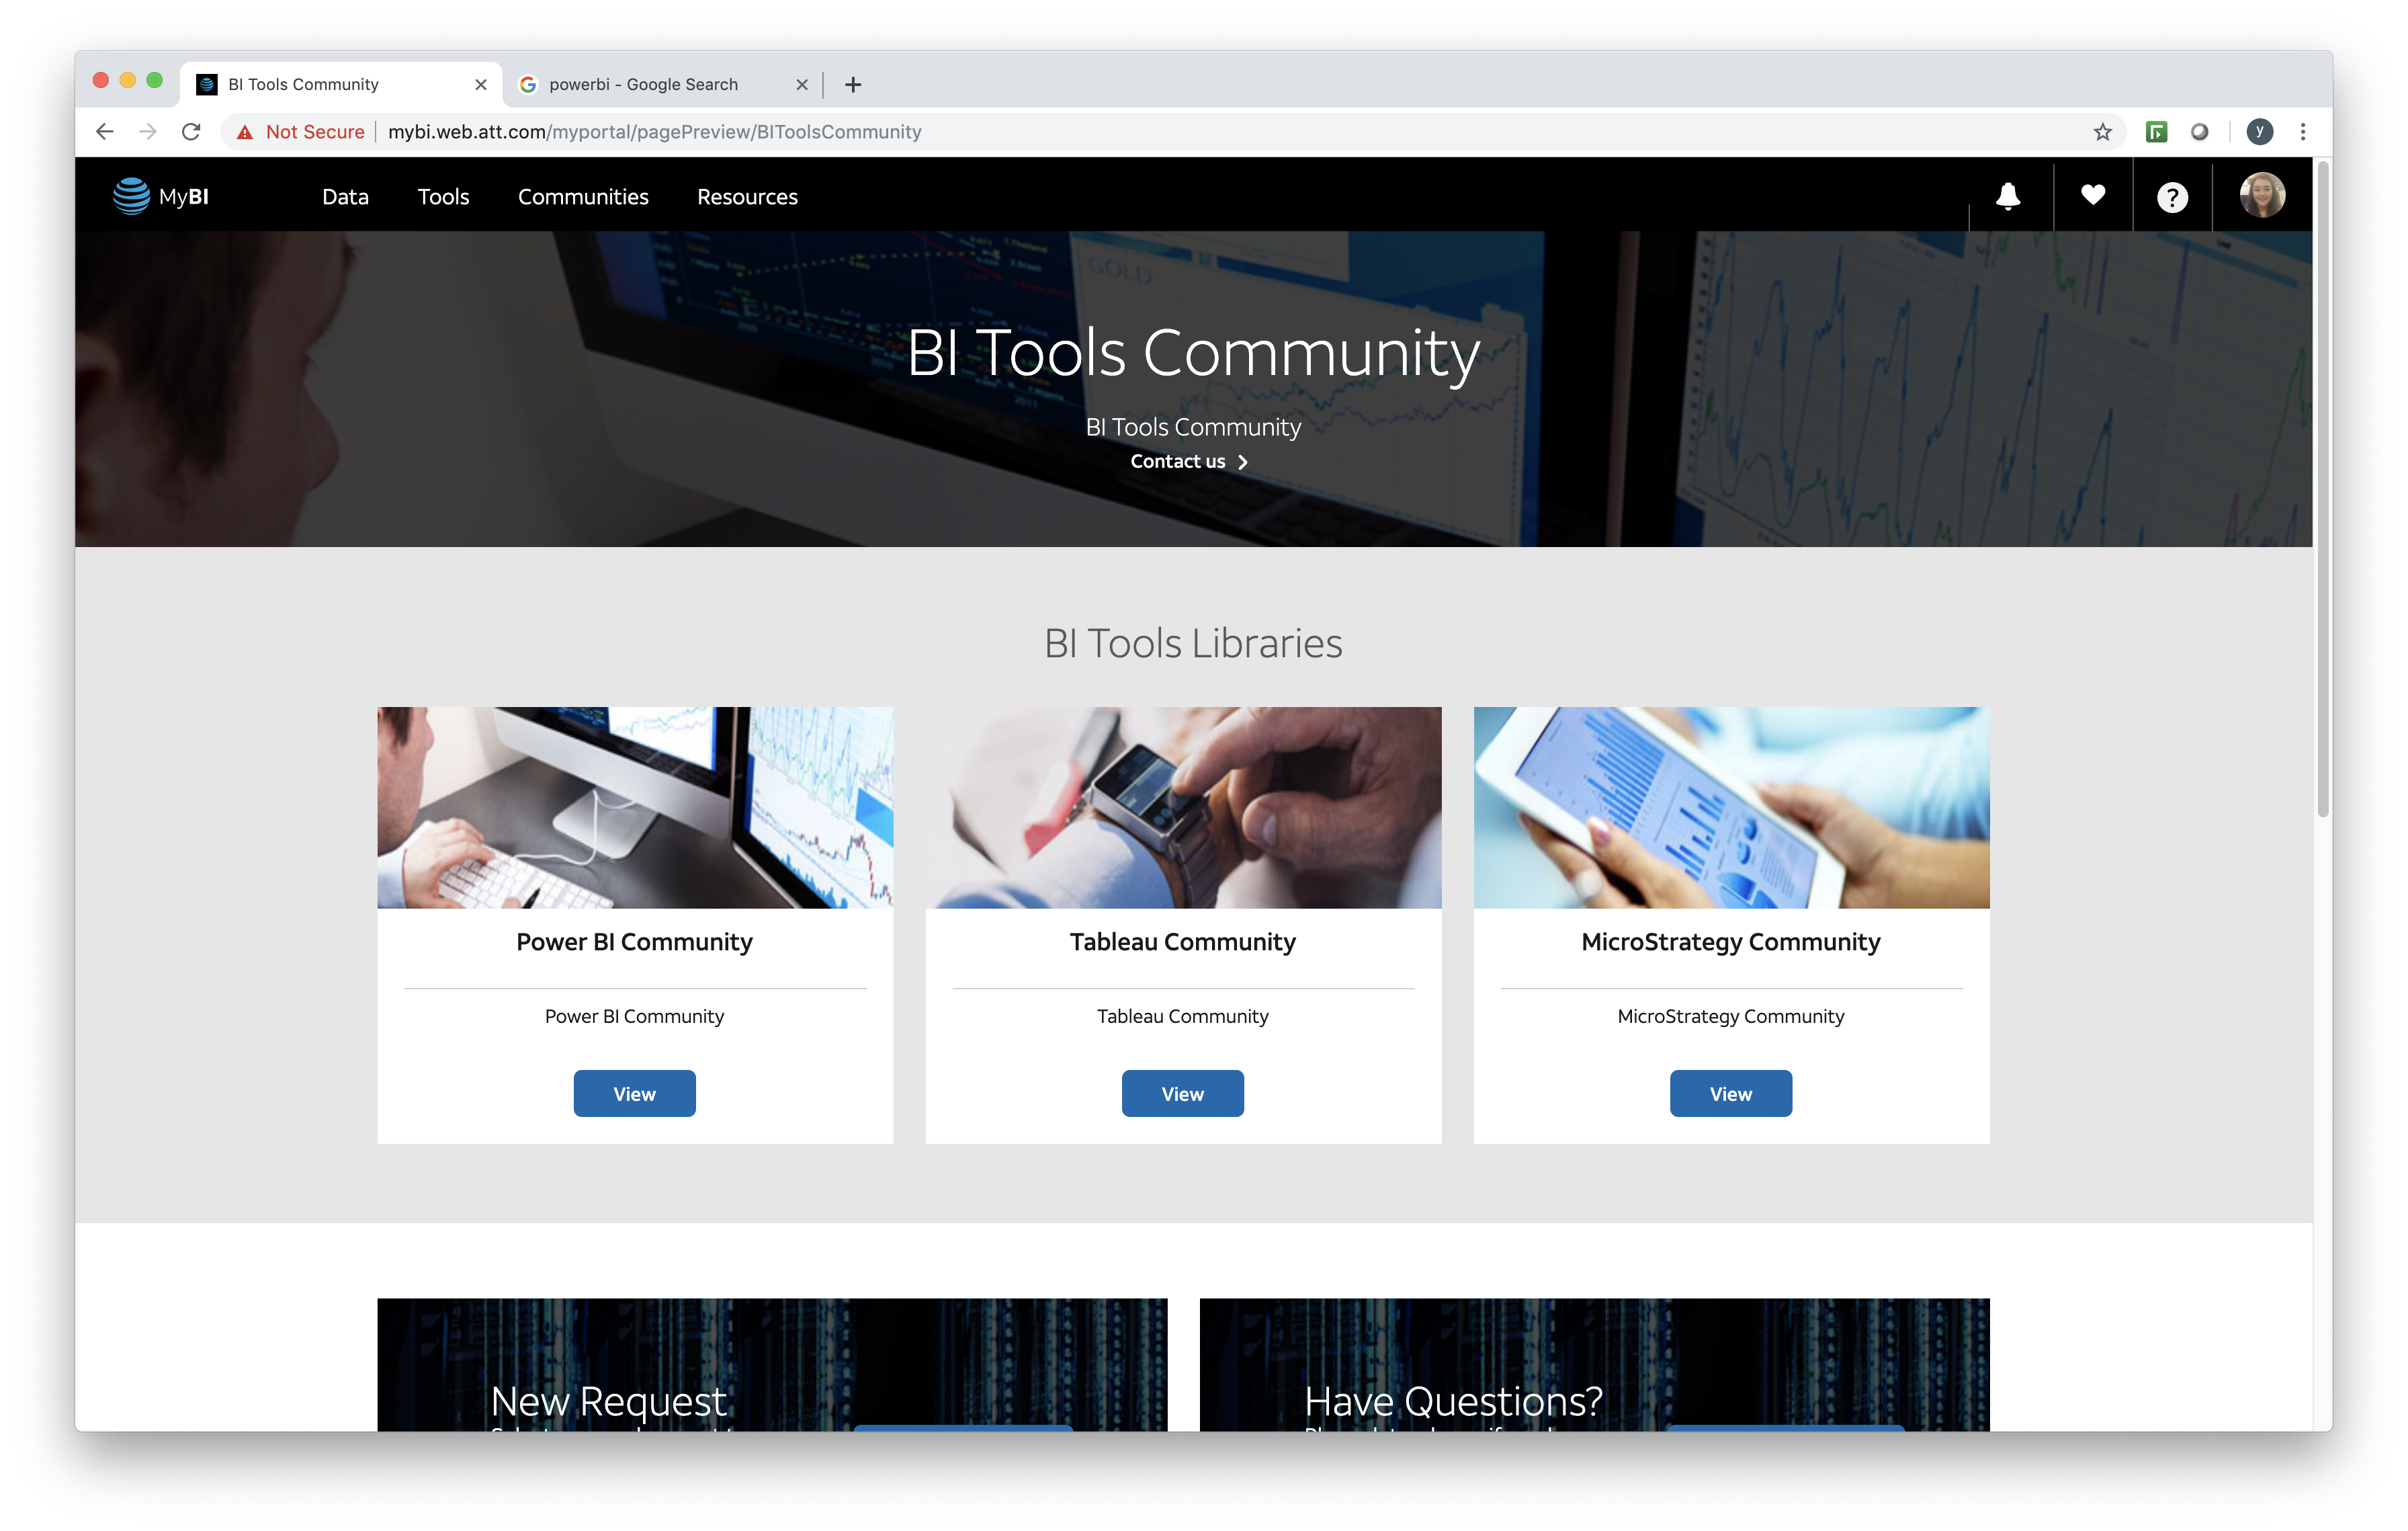
  • Unified fragmented BI into a governed platform experience with reusable patterns and shared services.
  • Standardized design systems and data visualization components for consistent delivery.
  • Improved adoption and delivery speed through governance + operational alignment.

AT&T + DirecTV Merger | Enterprise BI Transformation

During the merger, the organization faced fragmented BI systems across business units with inconsistent tools, duplicated data, and disconnected user experiences.

myBI Roadmap
  • Fragmented dashboards and reporting tools
  • Inconsistent UX across BI platforms
  • Low adoption and trust in data
  • Redundant systems increasing operational cost

This fragmentation created disconnected workflows and inconsistent data models across the enterprise.

To address these challenges, I led the transformation toward a unified BI platform.

Before: myBI Hub — IBM

E2E data / system visual
  • Siloed BI tools
  • Inconsistent dashboards
  • Manual workflows
  • Low adoption

After: Unified BI platform (AMP/MyBI)

After: Unified BI platform (AMP / MyBI) dashboard example
  • Unified BI platform (AMP / MyBI)
  • Standardized design systems
  • Scalable dashboards across business units
  • Improved usability and adoption

Note: Internal/FPO visuals; included to demonstrate measurement & governance framework.

  • Owned UX and platform strategy for enterprise BI transformation
  • Defined unified experience vision across data platforms
  • Established governance models (RACI, three-in-a-box)
  • Aligned Product, Engineering, and Data teams across business units
  • Led product operations alignment to standardize delivery and improve platform efficiency
  • Architectural authority: set standards and mentored teams to keep patterns consistent across product lines

  • Designed and implemented scalable design systems for BI platforms
  • Consolidated multiple tools into a unified platform experience
  • Created data visualization standards and reusable components
  • Enabled Agile delivery workflows across teams

I drove this transformation through a combination of platform strategy, design systems, and operational alignment:


  • Rolled out across 10+ product lines and business units
  • Integrated into Power BI and enterprise data platforms
  • Embedded within Agile product delivery and release cycles
  • Supporting 30K+ enterprise users across distributed teams

Developed in collaboration with BI/data teams and refined over multiple years of enterprise use—ensuring accuracy, usability, and sustained adoption at scale.

Note: Internal/FPO visuals; included to demonstrate measurement & governance framework.


  • Drove adoption through internal communications, newsletters, and training
  • Created engagement programs to onboard users to the new platform
  • Increased platform usage and cross-team alignment

To ensure adoption across the organization, I established structured communication and engagement programs:

This unified BI platform became the foundation for AI-driven decision systems.

  • Decision paths: standardized KPI and exception workflows create clean entry points for copilots and contextual assistants.
  • Trust & governance: shared definitions, consistent models, and standardized patterns reduce “multiple truths” — enabling explainable recommendations.
  • Human control: high-impact recommendations require review/confirm gates; low-risk suggestions remain assistive.
  • Measurable rollout: instrumentation + adoption signals determine whether AI patterns expand across business units.
  • Executive validation: KPI clarity and decision readiness confirmed with leadership stakeholders.
  • Workflow validation: iterated with analysts and operational users to ensure patterns matched real decision workflows.
  • Rollout validation: adoption and engagement signals used to guide phased rollout across business units.

The impact of design wasn’t just interfaces — it was aligning systems, teams, and data so better decisions could be made reliably at scale.

This is “modernization without disruption”: standardize what matters (patterns, governance, shared services) so multiple teams can ship faster without fragmenting trust.

Case Studies

Case Studies

image
Enterprise BI Dashboard Modernization

DIRECTV

(Decision Support)

Case Study
image
Decision System Modernization

AT&T

(Foundation for AI-Assisted Workflows)

Case Study
image
End to End

AT&T's Data Quality

Dashboard Redesign

Case Study
image
AI Interaction Architecture for Enterprise Decision Workflows

Ask AT&T

Decision Intelligence Layer

Case Study
image
Enterprise Case Studiespace Standardization

Northrop Grumman

(SharePoint Under Constraint)

Case Study
image
Responsive Prototype Factory

SADA Systems

(Bootstrap + UI Components)

Case Study
image
Creative Direction

GuideStudio

(Brand + Web + Print)

Case Study

get in touch

Contact Me

Let's Jump In!