person

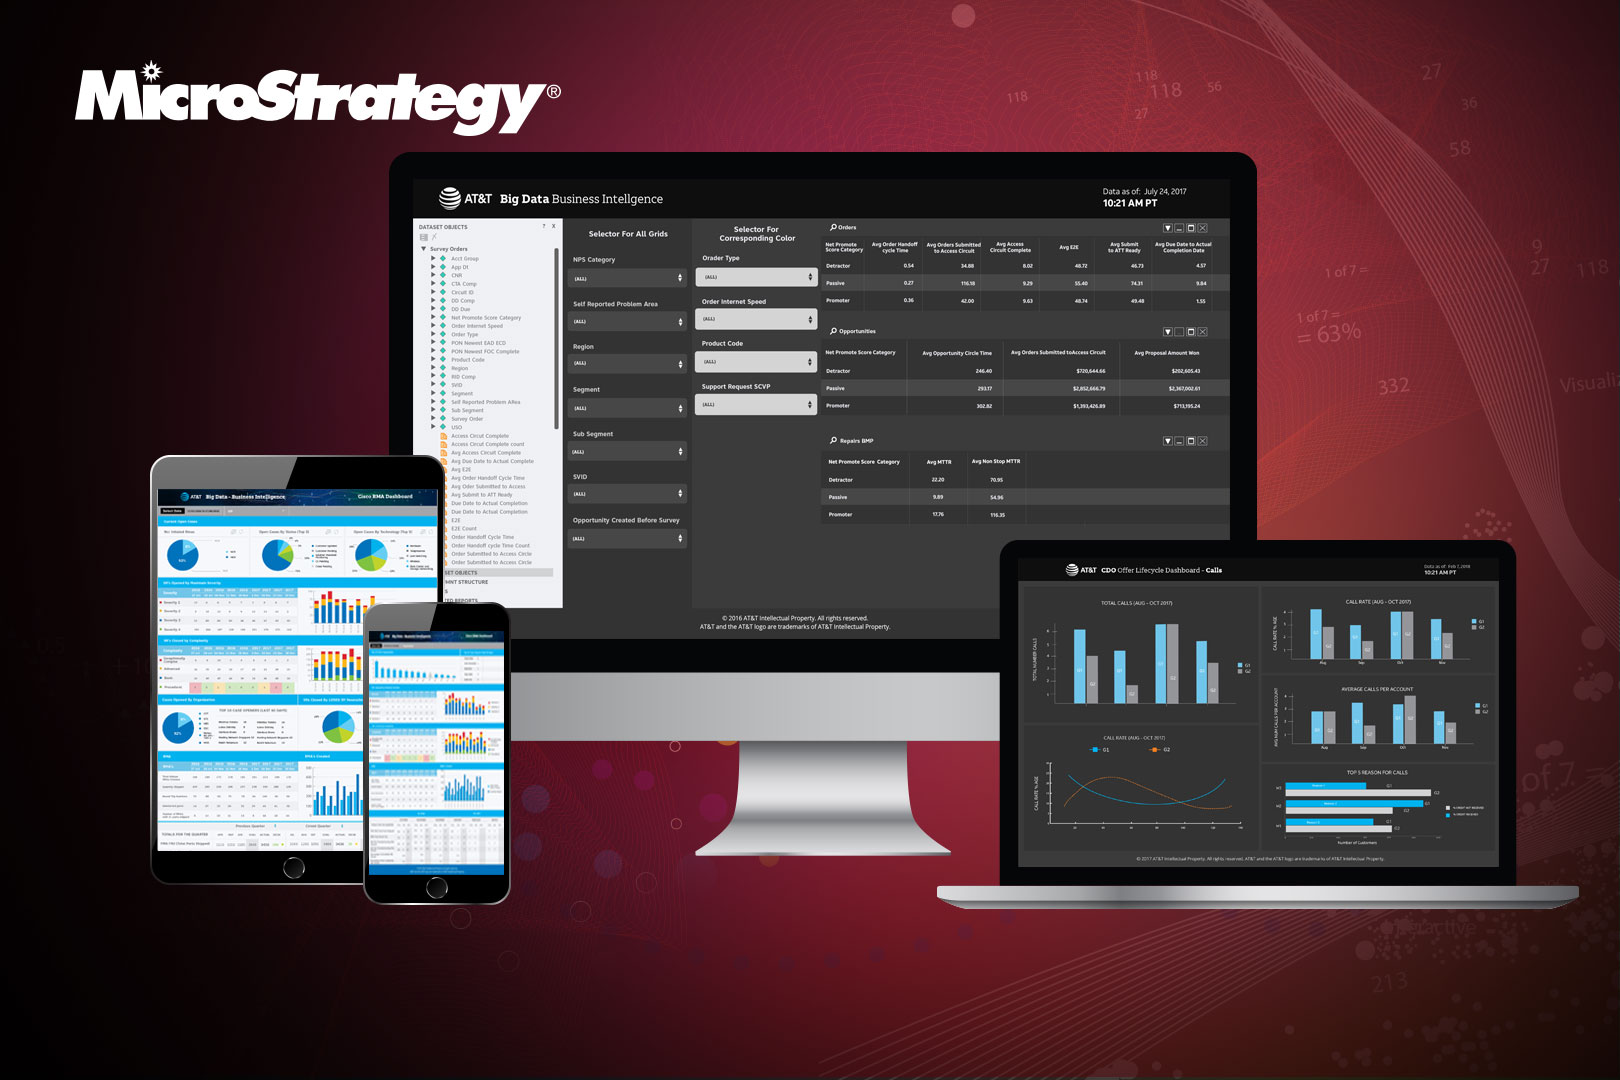
DIRECTV — Enterprise BI Dashboard Modernization (Decision Support)

Standardized how the organization interprets and acts on data—converting fragmented BI into a governed decision system used across business units.

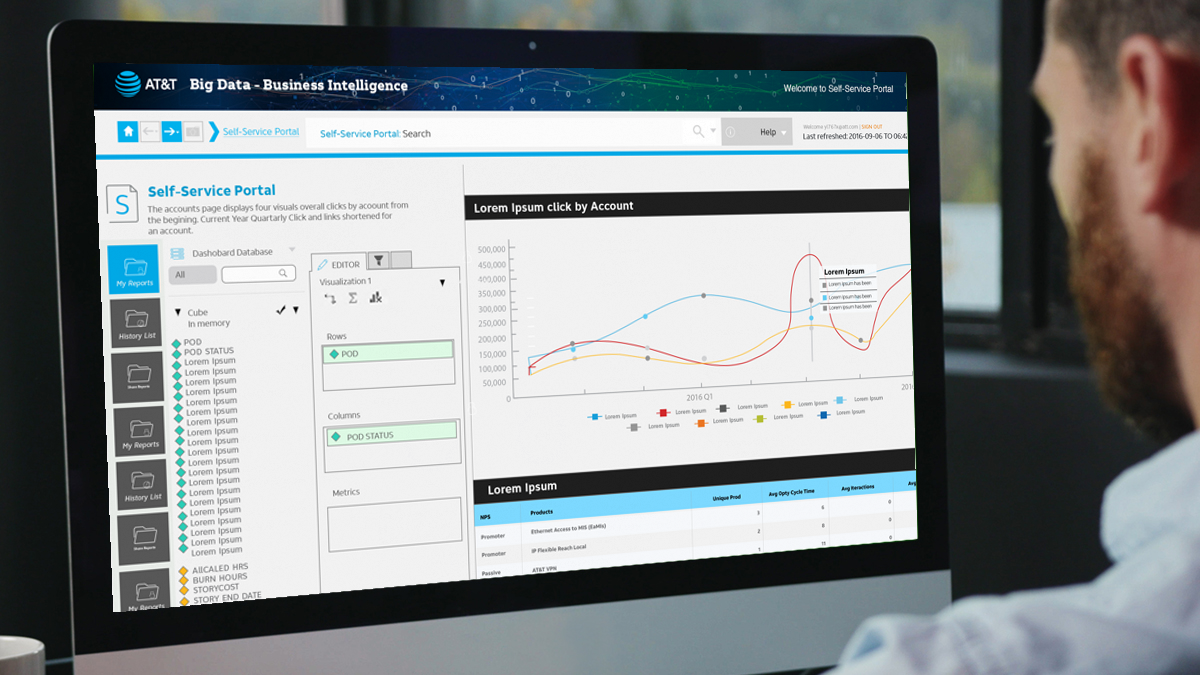
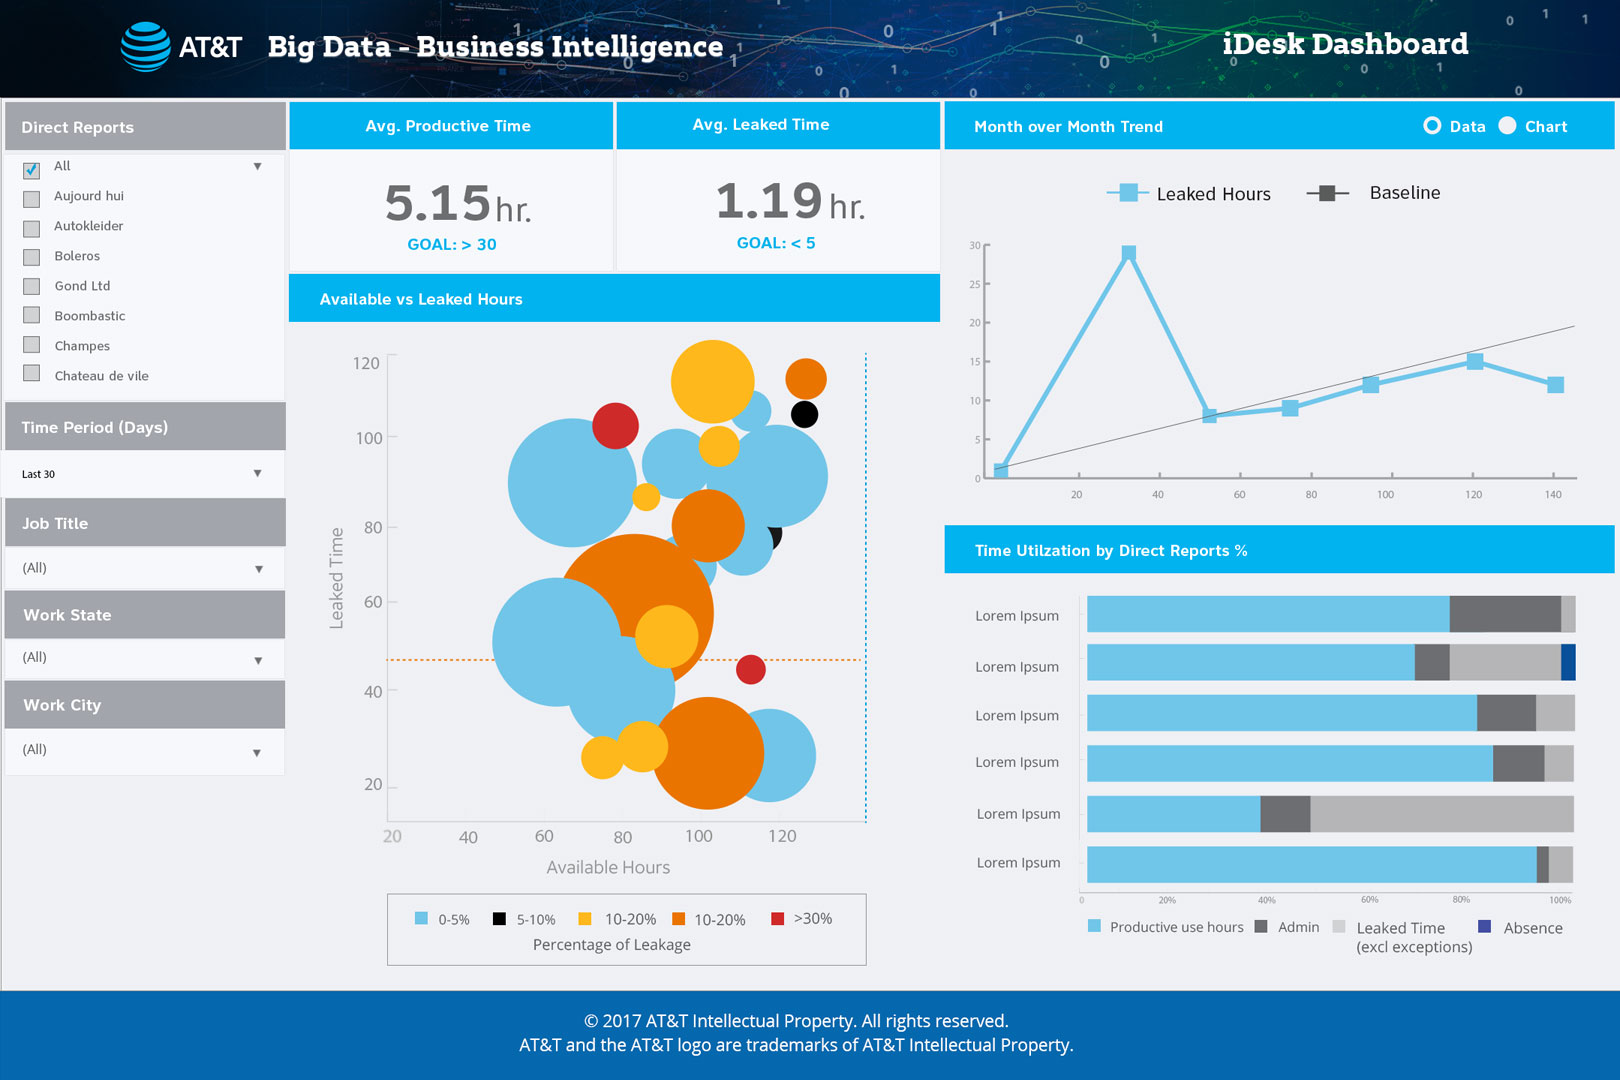
Mandate: Increase decision velocity and reduce reporting friction by redesigning BI dashboards for clarity, consistency, and usability across teams.

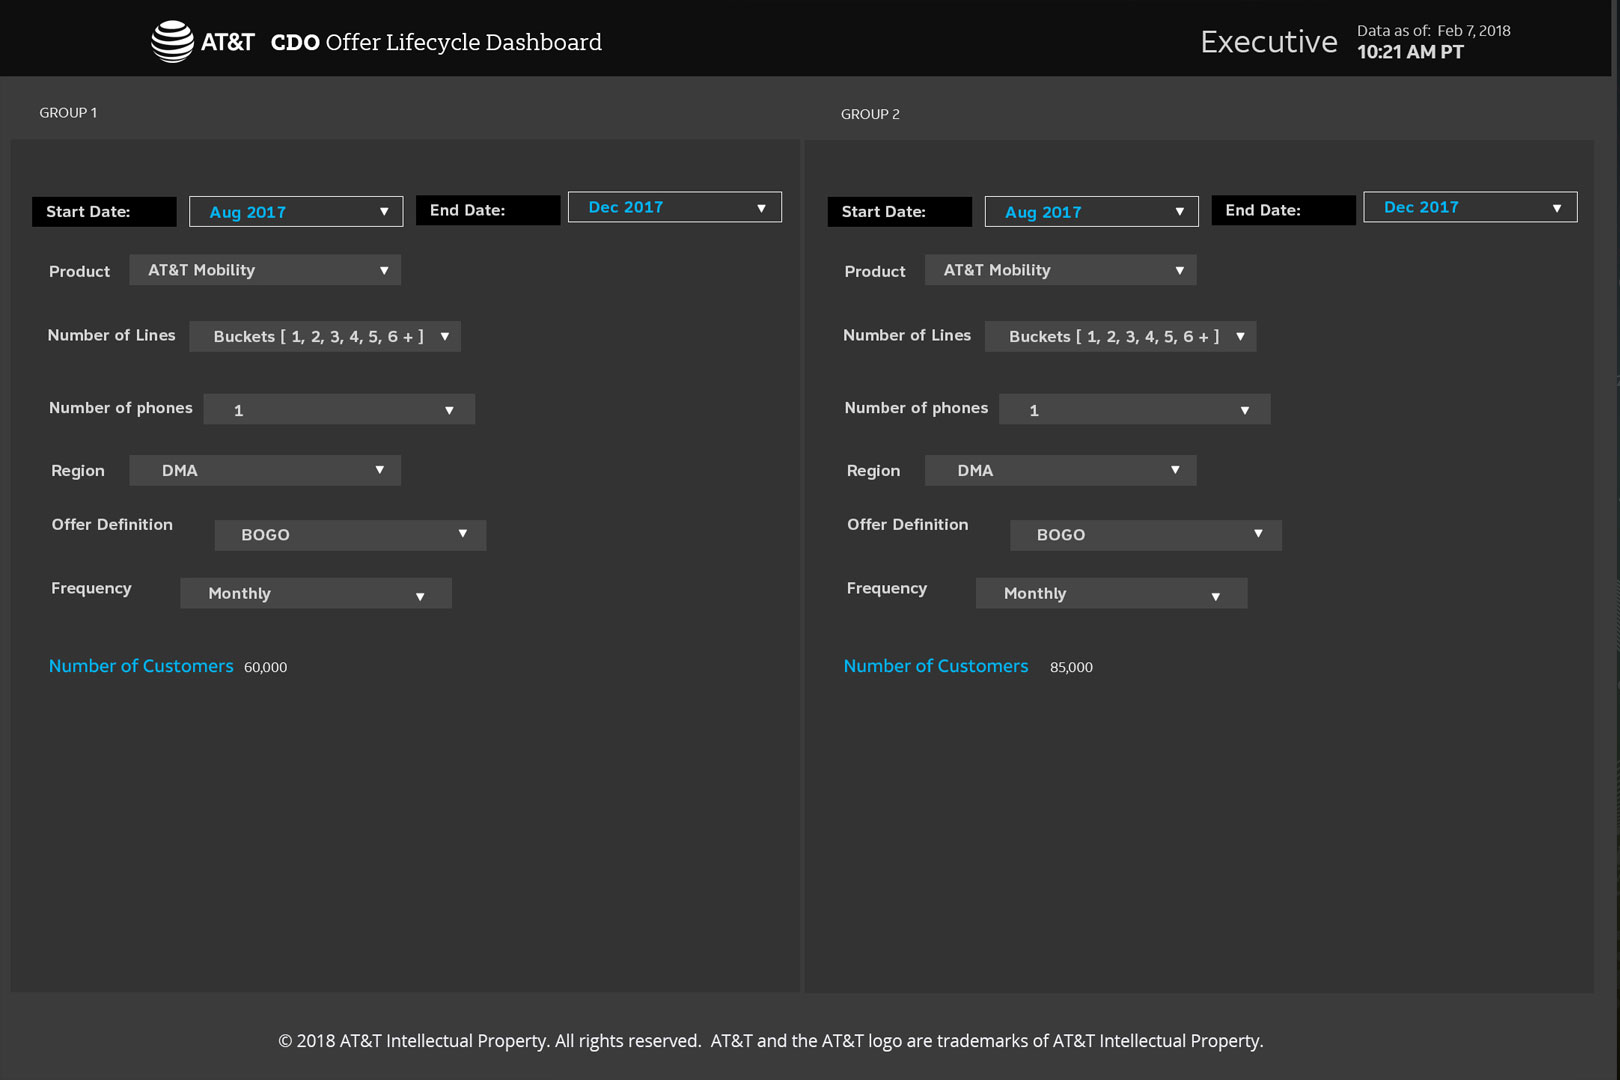
Scope: Dashboard UX modernization across multiple business units—navigation model, visualization standards, role-driven views, and interaction patterns for faster insight-to-action.

Role: Principal Design Analyst (BI Platforms) — defined the experience vision, standardized dashboard interaction patterns, and aligned product + data engineering on a single delivery approach.

Leadership Footprint:

  • System, not screens: shifted teams from "dashboard-by-dashboard design" to reusable standards and decision-ready views.
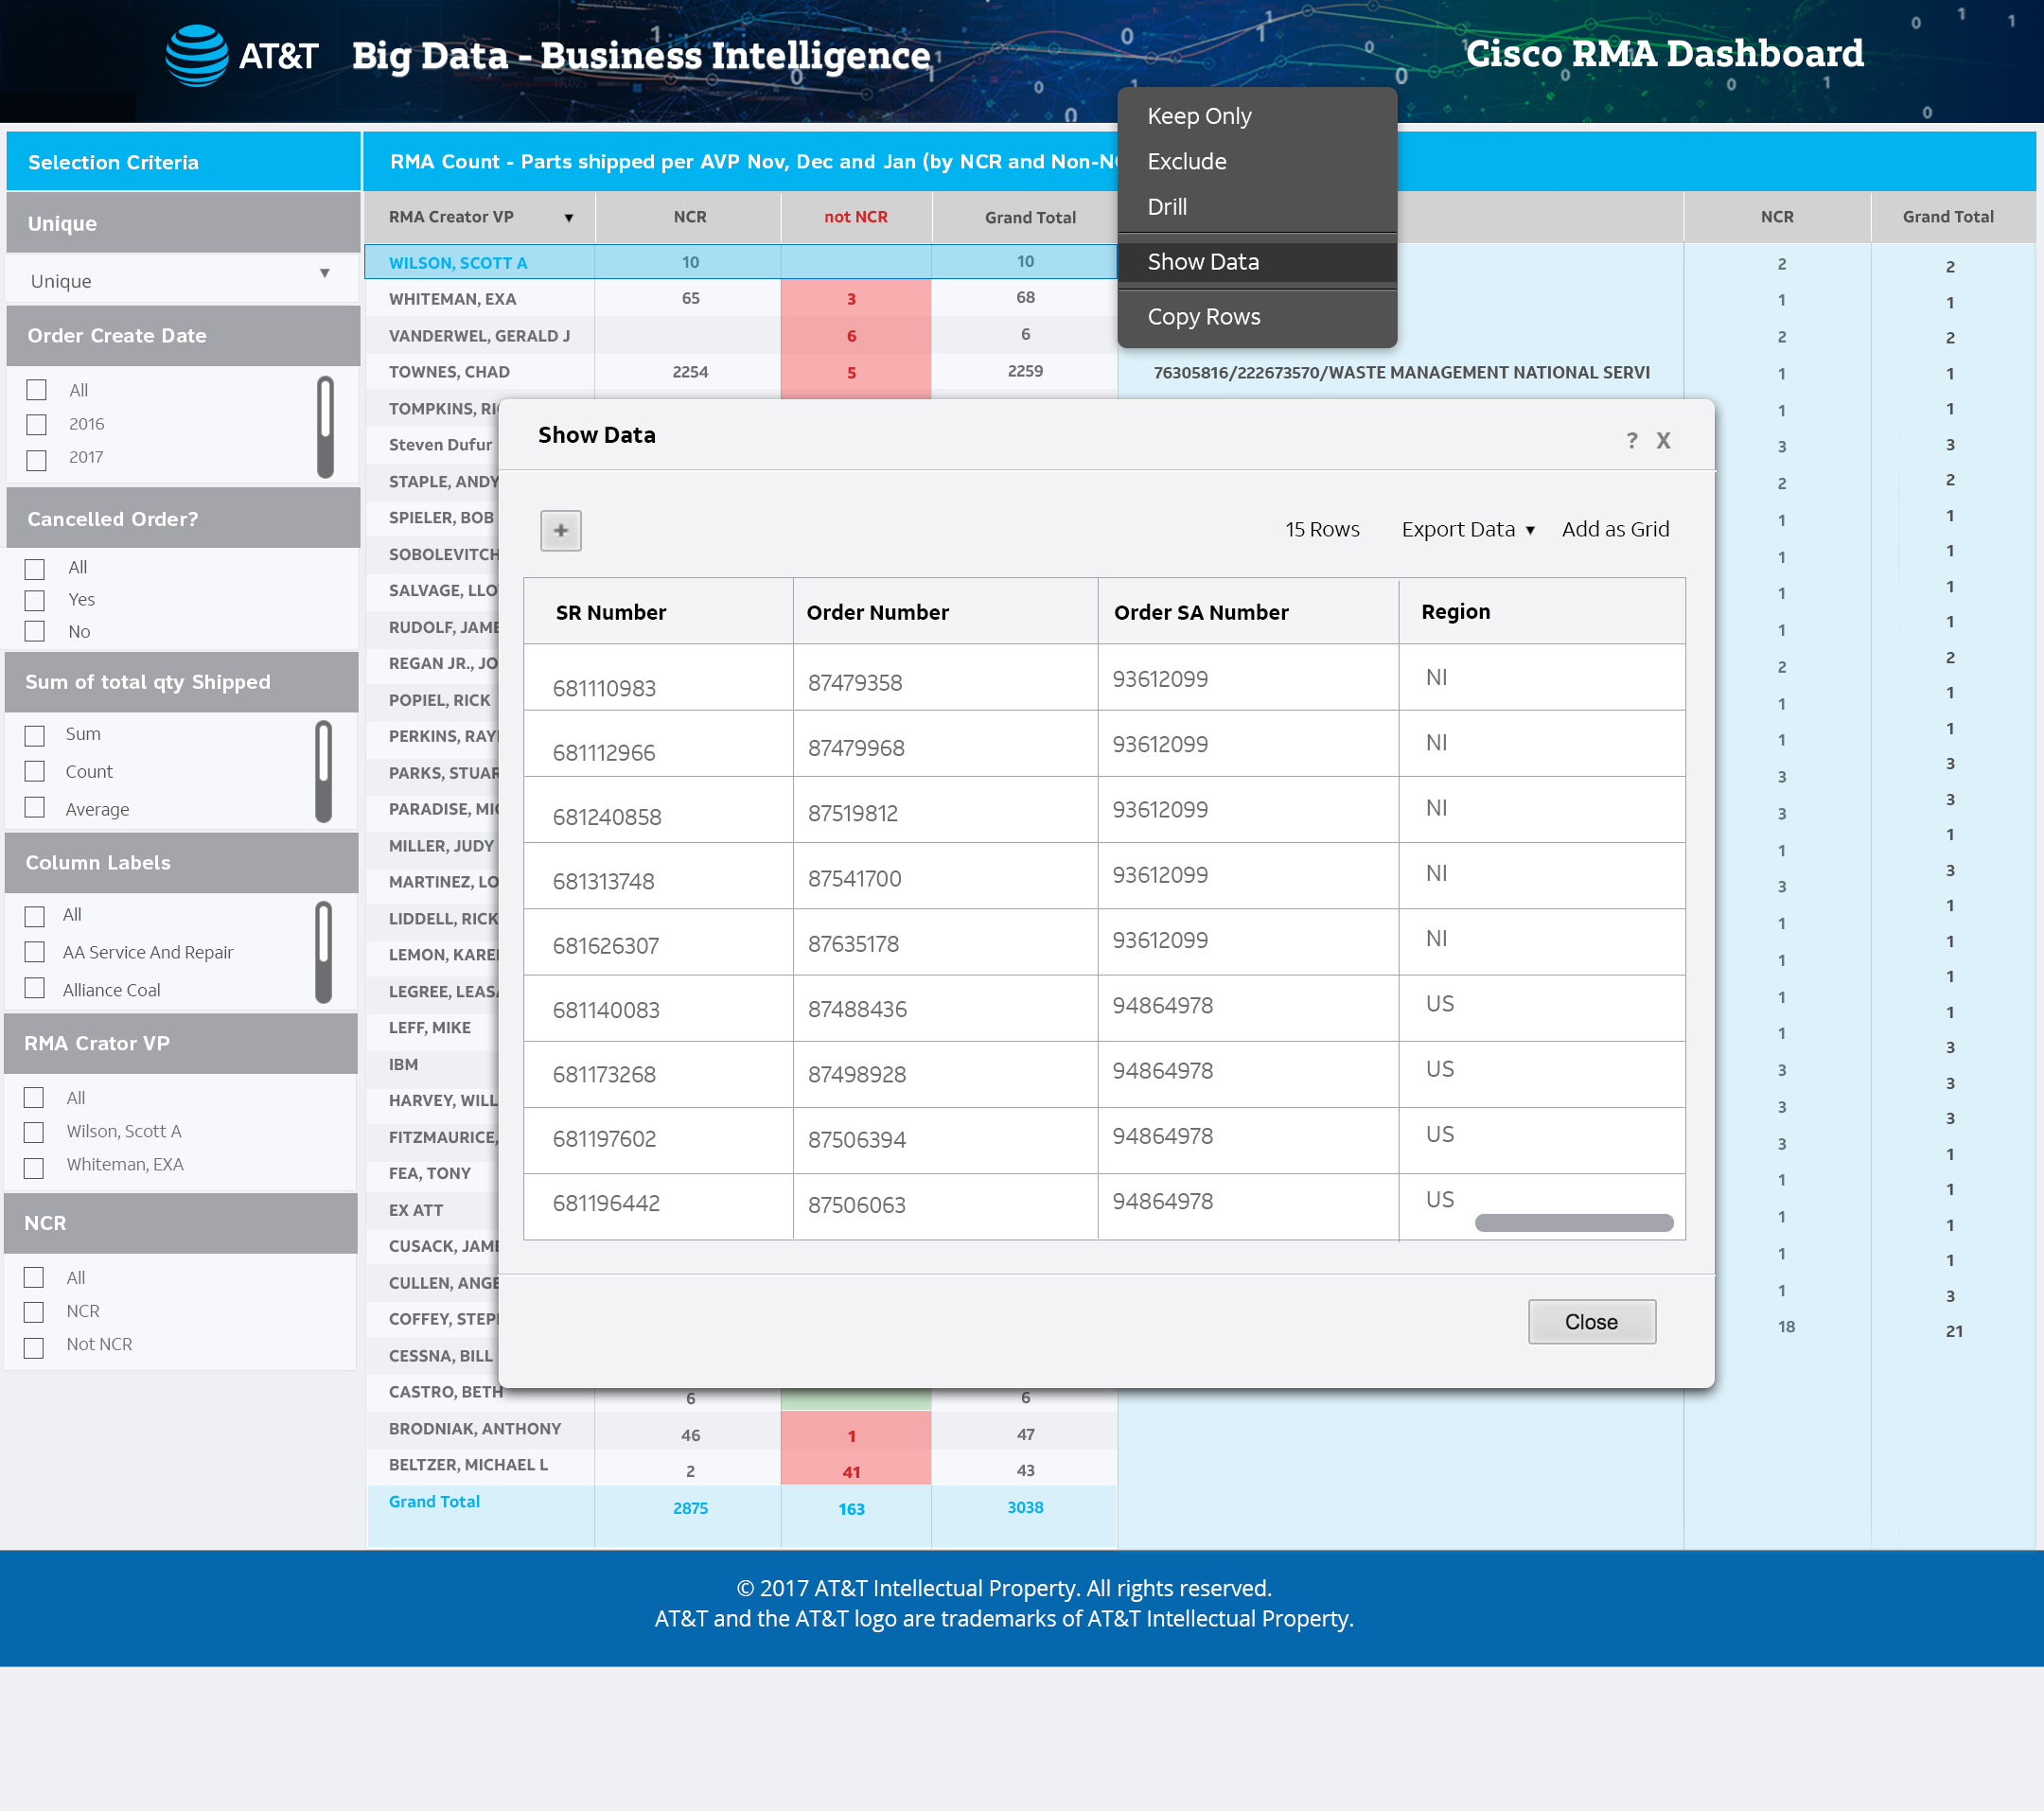
  • Hard calls: introduced clarity rules (KPI hierarchy, labeling, interaction consistency) so dashboards earned trust.
  • Scale execution: balanced speed with standardization by prioritizing reusable components and templates first.
  • Engagement: +40% user engagement (internal).
  • Decision speed: −30% time spent navigating data to reach answers (internal).
  • Efficiency: ~$1.5M annual cost savings via reduced manual reporting and fewer errors (internal).
  • Trust: +12% improvement in data accuracy through clearer validation visibility (internal).
  • Embedded into enterprise workflows: standardized decision paths so teams reach the right KPI faster (foundation for copilots/contextual assistants).
  • Reusable patterns & constraints: defined dashboard interaction standards and templates to prevent fragmentation across teams.
  • Trust cues: improved clarity and consistency so metrics are interpretable and decision-ready.
  • Enterprise governance primitives: designed for audit trails, access controls, and policy constraints to be enforced consistently across teams.
  • Cross-org influence: aligned Product and Data Engineering on a single operating model for scalable adoption.

Company: DIRECTV
Duration: June 2018 – November 2020
Tools: MicroStrategy, Power BI, IBM Cognos, Figma, JIRA, UserTesting
Team: PMs, Data Engineers, UX/UI, QA (10 total)

Multiple business units relied on BI tools that lacked consistency, clarity, and usability—driving low engagement and slow decision cycles. I led the dashboard modernization to standardize the experience, improve navigation, and make insights easier to interpret and act on across teams.

Fragmented BI systems were creating inconsistent KPI interpretation across business units, slowing decision-making and increasing reliance on manual analysis.

Without a standardized decision framework, leadership lacked a reliable, scalable way to act on data—limiting operational efficiency, performance accountability, and cross-team alignment.

DIRECTV BI dashboard modernization sample
  • Defined a cross-business decision system standard — established KPI hierarchy, interaction patterns, and trust cues adopted across teams.
  • Shifted from dashboard delivery to platform governance — replaced one-off requests with reusable templates and standards to ensure consistency at scale.
  • Drove alignment across product + data engineering — ensured decision logic, performance, and UX patterns scaled together across business units.
  • Built the decision architecture required for AI — structured KPIs, trust signals, and role workflows so future AI recommendations would be usable and governable.
Dashboard modernization concept
  • Cross-functional execution: Worked with a 10-person team across PM, data engineering, design, and QA to ship consistent experiences (internal).
  • Business stakeholder engagement: Structured recurring reviews with marketing, operations, and finance to prioritize what "decision-ready" meant for each role (internal).
BI user types

BI User Types

SAS enterprise production retire

SAS Enterprise Production Retire

SIGNAL INSIGHT DECISION ACTION (+ role views • standards • trust cues)
  • Research: Interviewed 20+ internal users to identify friction, missing signals, and role-driven needs (internal).
  • Prototyping & validation: Iterated via Figma prototypes and user feedback loops; used comparisons to converge on the clearest UI patterns (internal).
  • Personalization: Enabled role-based dashboard customization so teams focus on the right metrics without overload (internal).
  • Scalability: Partnered with data engineering to keep dashboards usable and performant at scale (internal).
iDesk Dashboard

iDesk Dashboard

BOGO Lifecycle Dashboard Wireframe

BOGO Lifecycle Dashboard Wireframe


Reframing: These results reflect decision-system performance—not just UX polish.

  • Decision Velocity: Reduced time-to-decision by 40% by structuring how signals convert into actionable insights.
  • Adoption & Utilization: Increased adoption by 50% by aligning decision surfaces to role-specific workflows.
  • Operational Efficiency: Delivered ~$1.5M in savings by reducing manual interpretation and redundant analysis cycles.
  • Trust & Quality: Improved data confidence by making definitions, sources, and validation visible at the point of use.

Note: Metrics are internal program measures.

BI doesn’t fail on charts—it fails on fragmented decision systems. Without standardized decision structures, organizations can’t scale clarity—and AI only amplifies inconsistency. Strong decision systems are what make intelligent automation usable, trustworthy, and scalable.

Case Studies

Case Studies

image
Enterprise BI Dashboard Modernization

DIRECTV

(Decision Support)

Case Study
image
Decision System Modernization

AT&T

(Foundation for AI-Assisted Workflows)

Case Study
image
End to End

AT&T's Data Quality

Dashboard Redesign

Case Study
image
AI Interaction Architecture for Enterprise Decision Workflows

Ask AT&T

Decision Intelligence Layer

Case Study
image
Enterprise Case Studiespace Standardization

Northrop Grumman

(SharePoint Under Constraint)

Case Study
image
Responsive Prototype Factory

SADA Systems

(Bootstrap + UI Components)

Case Study
image
Creative Direction

GuideStudio

(Brand + Web + Print)

Case Study

get in touch

Contact Me

Let's Jump In!